Oct 1, 2024 • 5 min read
Alert Evaluations: Incremental Merges in ClickHouse
Highlight.io is an open-source app monitoring platform, and our blog documents the infrastructure challenges we encounter while building our product. Interested in learning more? Check us out at https://highlight.io.
Some Background
At Highlight, we rely on ClickHouse, an open-source columnar database built for handling large datasets and real-time analytics. It’s been essential to us for storing and querying our time-series data (logs, traces, errors, etc.), and allowing for quick aggregations and filtering. Using a newer database, however, has its own challenges (which we’ve written about here). Here, we’ll talk about how some particular ClickHouse features helped us solve performance issues.
The Challenge
Recently, we faced a challenge when optimizing our alert system. Determining whether to fire alerts based on calculations over large time windows became prohibitively slow. Processing large data volumes in real time wasn’t an option because a scan over the full data set would take too long and use too much memory. Below, we discuss our journey in solving this problem using ClickHouse’s aggregate functions for incremental calculations - computing and storing smaller partial results and then merging those results together later.
The Problem
Consider a user wanting an alert when the p99 (99th percentile) duration of a network request exceeds one second over the past hour. To provide near real-time feedback, we evaluate these alerts every minute. Naively, this requires recalculating the alert for the entire one-hour window each minute, which requires that we scan the same data 60 times per hour per alert, causing substantial computational overhead.
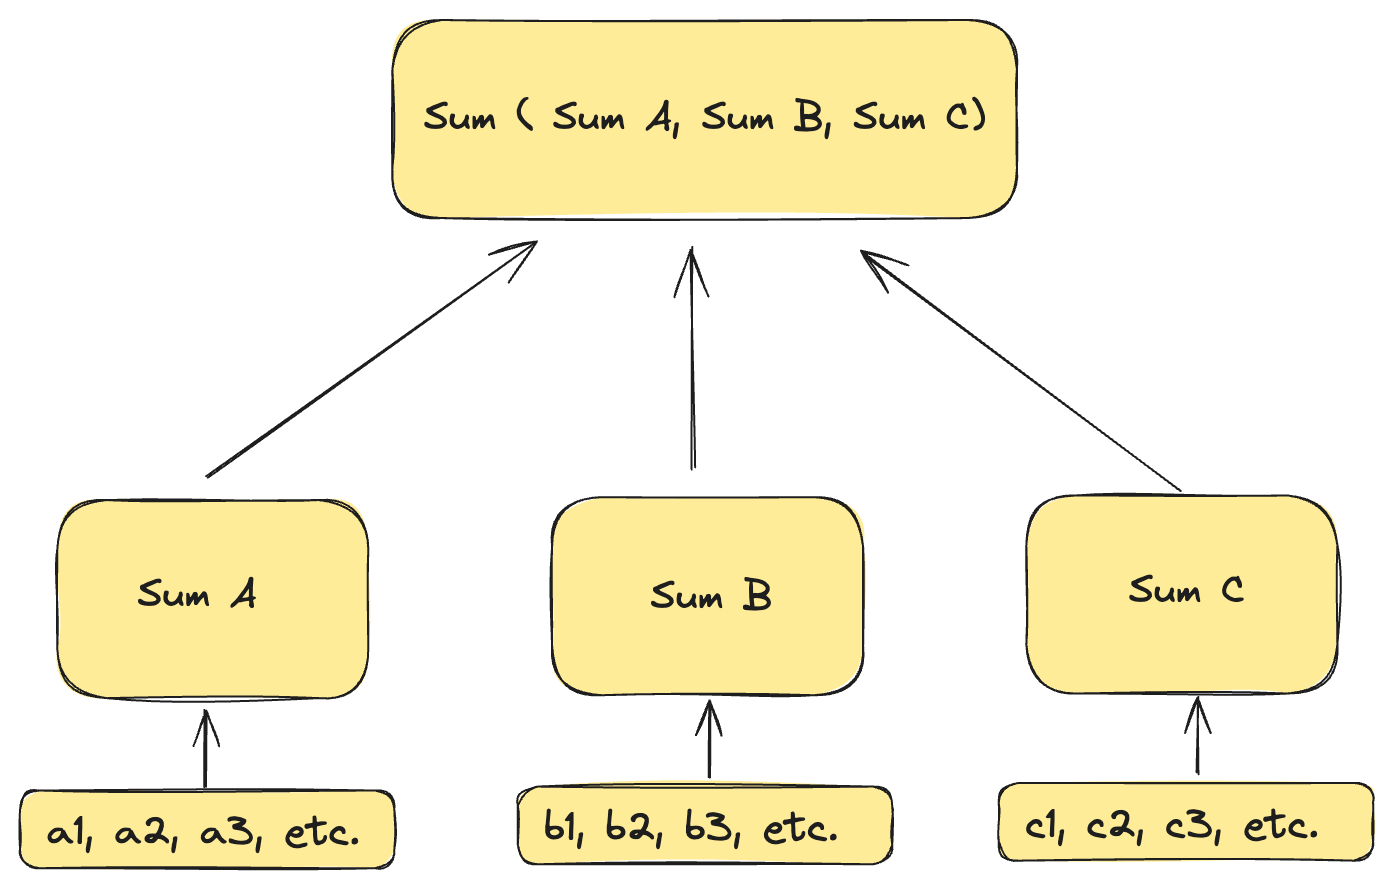
Simple Incremental Merges
For simple aggregate functions like Count and Sum, we realized we could optimize these by saving the results of previous calculations. Instead of recalculating from scratch every minute, we could compute values incrementally and aggregate intermediate results.
For example, if we set up a log alert to fire whenever there are more than 100 logs in an hour, we can count and save the number of logs every minute, then load and sum the values for the last 60 minutes to check against our threshold of 100.
Below is a trivial diagram of how a sum of log line counts is calculated in intermediate steps.
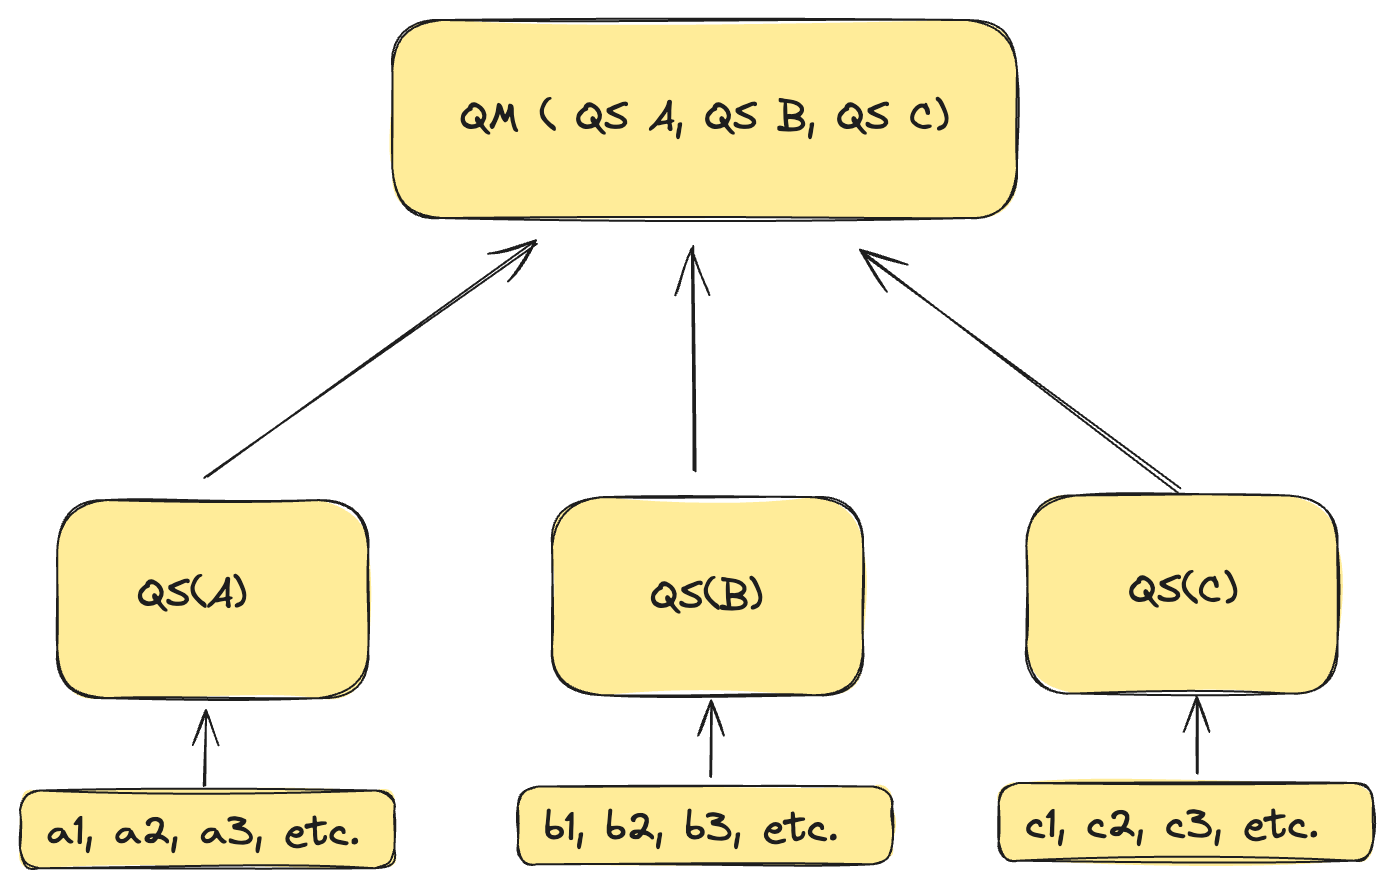
But then it gets complicated…
When it comes to more complicated aggregation functions, however, this approach won’t work. For example, if we wanted to calculate an exact p50 (or median) value, over 5 windows, we can't simply calculate 5 intermediate p50 values and “rollup” the results. Instead, we would have to store every data point to run the calculation.
ClickHouse's powerful -State and -Merge combinators, however, allow us to calculate intermediate values (in a similar way to the “Count” or “Sum” approach). The -State functions return intermediate states, while the -Merge functions combine these states.
Below is another diagram that describes the mechanics around the state functions (denoted as “QS” for quantile state) and the merge functions (denoted as “QM” for quantile merge).
State and Merge Functions in a Nutshell
Clickhouse uses memory-efficient approximate algorithms to implement many of its complex aggregate functions. Two examples of these functions that Highlight uses are uniq and quantile. uniq returns an approximate count of distinct values, while quantile is used for an approximate p50, p90, etc. These algorithms use different forms of sampling to obtain a set of representative values from the underlying distribution.
uniqState and quantileState return the underlying state representations of these calculations. Because they are sampling algorithms with a finite maximum size, their memory usage is bounded. After calculating and saving these states, we can load and use them later with the uniqMerge and quantileMerge functions. These functions are the inverse, receiving the state as input and returning the result value. For example, uniqMerge(uniqState(x)) = uniq(x). The benefit here is that uniqState can be run and saved for multiple small pieces of input data, then later these results can be merged together. The size of these intermediate states is much smaller than the underlying input data, so it is much more efficient to do the state calculation once and merge multiple times later.
Implementing the Solution
Our approach involves loading all new data every minute, calculating intermediate states for this new data, and then merging these states with existing ones to get the aggregate value for the desired time range.
Our schema is:
(
    `MetricId` UUID,
    `Timestamp` DateTime,
    `GroupByKey` String,
    `MaxBlockNumberState` AggregateFunction(max, UInt64),
    `CountState` AggregateFunction(count, UInt64),
    `UniqState` AggregateFunction(uniq, String),
    `MinState` AggregateFunction(min, Float64),
    `AvgState` AggregateFunction(avg, Float64),
    `MaxState` AggregateFunction(max, Float64),
    `SumState` AggregateFunction(sum, Float64),
    `P50State` AggregateFunction(quantile(0.5), Float64),
    `P90State` AggregateFunction(quantile(0.9), Float64),
    `P95State` AggregateFunction(quantile(0.95), Float64),
    `P99State` AggregateFunction(quantile(0.99), Float64)
)
ENGINE = ReplicatedAggregatingMergeTree('/clickhouse/tables/{uuid}/{shard}', '{replica}')
ORDER BY (MetricId, Timestamp, GroupByKey)
SETTINGS index_granularity = 8192


Because the type of each state column is different, we have a separate column for each of our supported aggregate functions. Data is calculated with minute granularity.
We identify new data by checking all parts for the underlying table where max_block_number is greater than the last run’s max_block_number. This returns any parts which have new data, but some parts may contain data that has already been read. To avoid double-counting these, we enabled the allow_experimental_block_number_column on the underlying tables, and in our query we filter on each row’s _block_number.
Conclusion
Overall, leveraging ClickHouse’s -State and -Merge function combinators made our alert evaluation process significantly more performant. Testing log alert evaluation in a real-world Highlight workspace, we were able to achieve a 10x speedup (1.24s to 0.11s) while bringing the memory usage down from 7.6 GB to 82 MB.
For those interested in learning more, explore ClickHouse’s documentation on State and Merge operators here. Keep an eye on our blog for more behind-the-scenes looks at how we tackle technical challenges at Highlight.