Nov 3, 2022 • 4 min read
8 Tips to Help You Maximize Chrome DevTools
The Chrome Developer Tools are a great asset and an indispensable tool for anyone building for the web.
By providing a powerful toolset for developing and debugging web applications, Chrome DevTools enables developers to debug and style their frontend apps for responsiveness on Chromium-based browsers such as Brave, Edge, and Chrome.
But it offers more than just seeing the document tree and logging values to the Console. It provides you with an environment to test and iterate on your code, as well as understand and optimize the performance of your web application. Or any other web property, for that matter.
(P.S. here's how to even open the Chrome DevTools)
Whether you're just getting started with the DevTools or are a seasoned veteran, here are eight tips to help you make the most out of Chrome DevTools.
#1 Explore the Command Menu
The command menu on Chrome DevTools is a shortcut for running commands or code and accessing any visible piece of code in your application. It's also a great way to navigate menus and perform debugging operations.
To access the command menu, simply click on the three vertical dots at the top right corner of Chrome DevTools. You should then see the "Run Command" option. Alternatively, you can also open the command menu by using Ctrl + Shift + P on Windows or ⌘ + ⇧ + P on Mac.
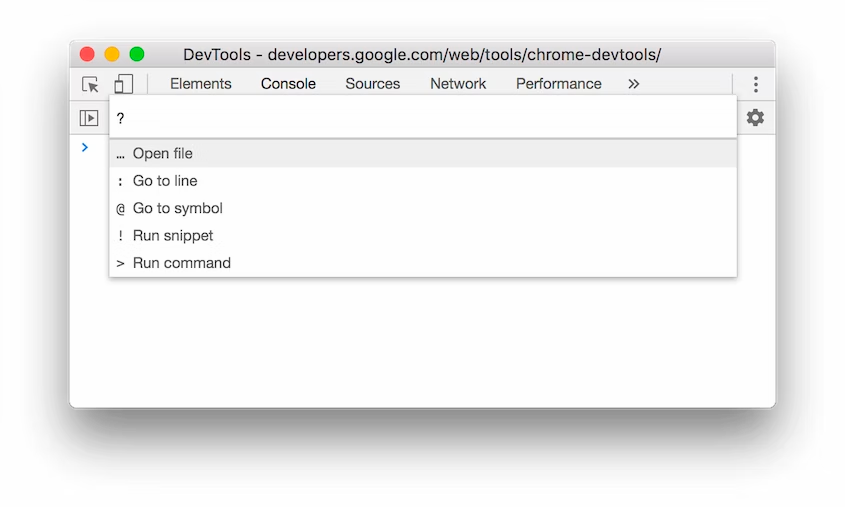
Once you have the command menu open, simply type in "?" to see a dropdown of all possible actions you can perform. If you want to disable JavaScript or go to a specific line number in your code, you can do so with just a few keystrokes.
So next time you're using DevTools, be sure to take advantage of the command menu. It'll save you tons of time and make your workflow much smoother.
Source: Chrome DevTools docs
#2 Copy Attributes & Selectors
One of the most useful features in Chrome DevTools is the ability to copy and paste elements.
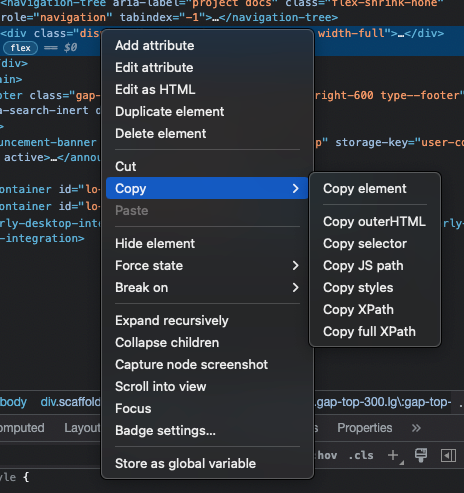
For example, if you see an element on a web page that you like, you can right-click it and select "Copy CSS" to copy all of the styling information for that element. Then, you can paste it into your own code and see how it looks.
It's a great way to quickly add styles to your own web app without having to manually write all of the CSS yourself. Similarly, you can also copy and paste JS path information to quickly add event handlers and other scripts to your app.
This feature can be especially useful when working with complex codebases or when trying to match a specific design. So next time you're using Chrome DevTools, give this tip a try and see how it can speed up your workflow.
Get the visibility you need
#3 Use Console Shortcuts
Chrome DevTools allows you to run commands or shortcuts in the Console. These shortcuts enable you to access or reference any piece of code in your app.
-
$_ returns the most recent expression you evaluated on the Console.
-
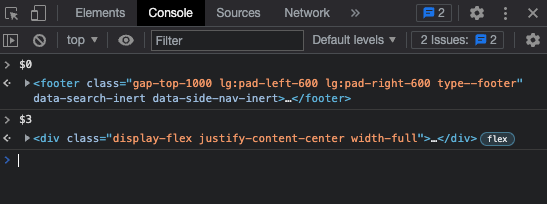
$0 references the last element you inspected on the Elements tab, and $1 references the second to the last. $2-$4 follows the same logic.
-
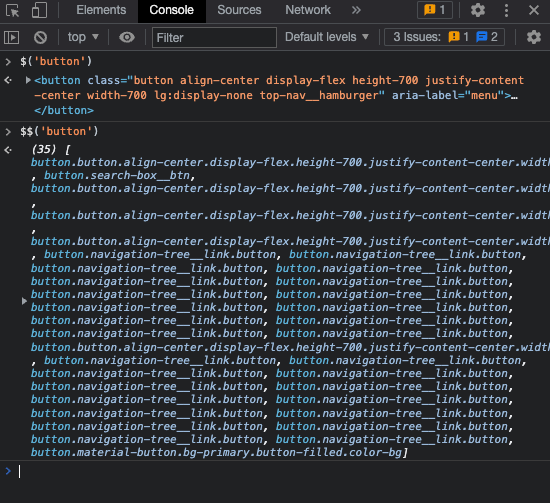
$() is the shortcut syntax for document.querySelector(), while $$() is the shortcut syntax for document.querySelectorAll().
Chrome DevTools documentation has more shortcuts that can help you reference elements and expressions faster.
#4 Create Code Snippets
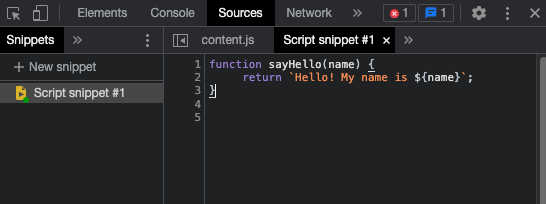
Want to play around with code like you would on CodePen? Chrome DevTools' Snippets can be your fast and simple code playground. You can write code, edit multiple lines simultaneously, and save it.
And the best part is that you can run your snippets on any web page — they don't have to be part of your actual web application.
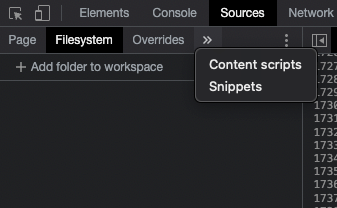
To access Snippets in DevTools, go to the Sources tab. If you don't see it right away, click on the double arrow below the tab to expand it. Then, just start creating and running your snippets. Trust us, these Chrome DevTools tips will save you a lot of time in the long run.
#5 Test Apps on Different Network Speeds
Not all our users have blazing-fast internet, so it's important to test your web app in different conditions.
In the Network tab of DevTools, you can compare your app's performance on different networks, like fast and slower 3G or custom network speeds. You can also simulate your app's performance when there's no network connection.
To test your app's performance, click on the Throttling dropdown, then start simulating different network connection speeds.
This Chrome DevTools tip will help you ensure that your app performs well for all users, regardless of their connection speed.
#6 Edit Content in Design Mode
If you're feeling artistic or curious, you can edit any web page you like, whether it's yours or not. Design mode on DevTools works similarly to the contenteditable attribute in HTML. You can set the design mode of any application and edit its content on the page.
To do this, type document.designMode = 'on' in the Console tab and press Enter. Then, click on any part of the page to add, delete image, or edit text as you like.
Keep in mind that your changes will only be temporary and will not be saved when you refresh the page. Nevertheless, this is a fun way to play around with web pages and see what you can create.
#7 Force Element State
When you're working on styling an element in HTML, it can be helpful to see what the element looks like in different states. For example, you might want to see how an element looks when it's hovered over, or when it's in focus.
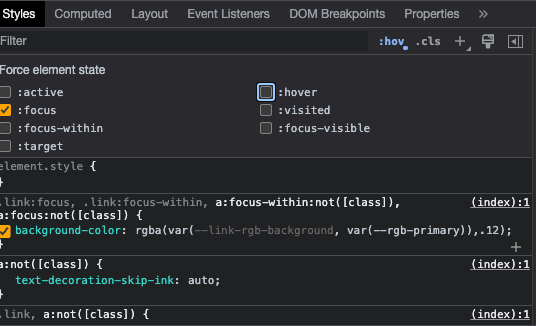
You don't have to keep moving your cursor every time you want to debug the hover states of buttons or test changing styling. Chrome DevTools allows you to force any state and put your mouse to better use, like copying or editing the styles.
In the styles part of the Elements tab, you can force a state of an element. For example, the state could be on hover, focus, active, or visited. You only have to click on the component whose state you want to force, then click on :hov. You'll see all the states available for you to try out.
#8 Search Code
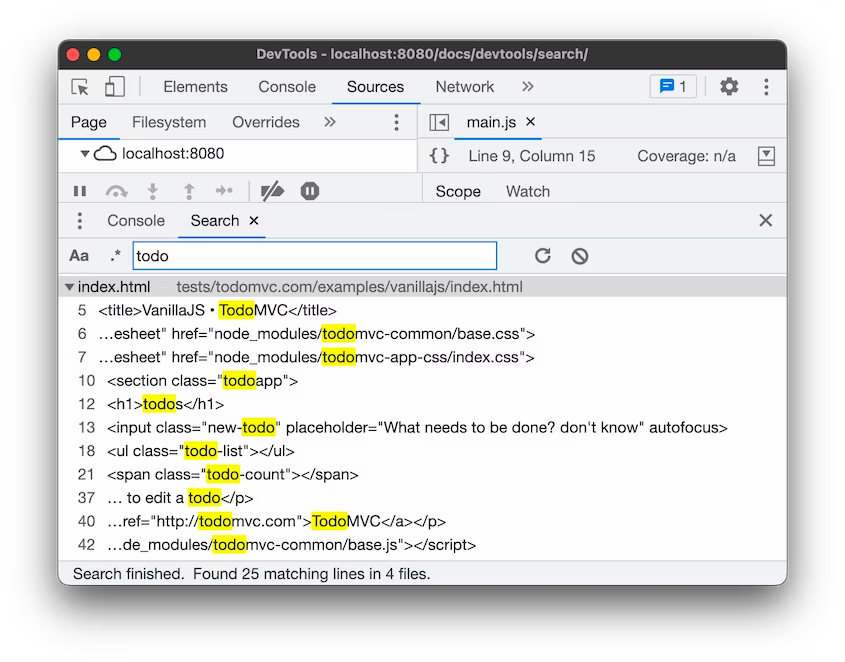
So you're working away in your app, and you need to find a particular piece of code. Maybe it's a string that you want to change or a function that you want to optimize. Whatever it is, DevTools has a handy feature that lets you search for anything in all loaded scripts.
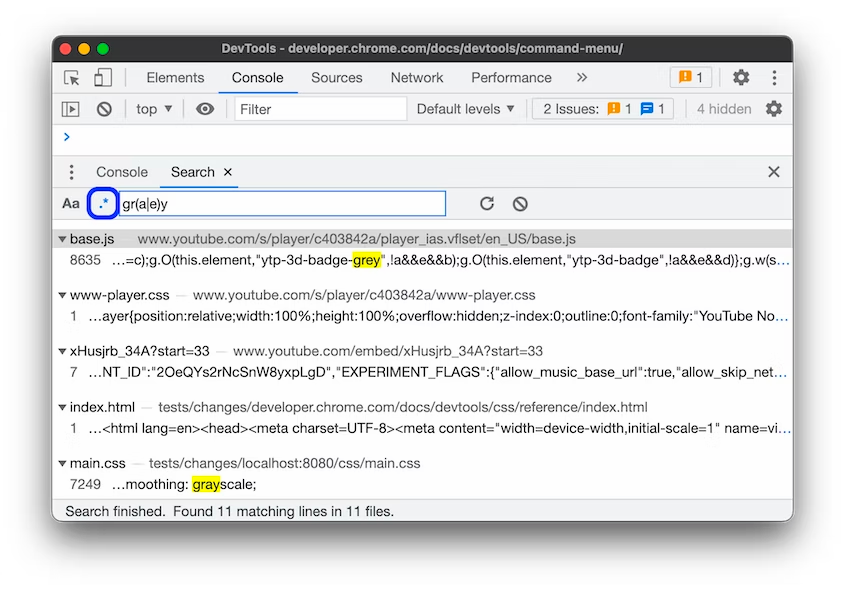
Just open up the Search bar (you can find it at the bottom of DevTools, or by clicking on the three dots dropdown), and type in what you're looking for. You can also use Ctrl + Shift + F on Windows or ⌘ + ⌥ + F on Mac.
Your query can be case-sensitive or a regular expression, and DevTools will return results for every instance where your query exists. Clicking on any result will then open it in the relevant DevTools panel.
Source: Chrome DevTools docs
Debug with Chrome DevTools
Now that you know some of the best tips and tricks for using Chrome DevTools put them into practice and see how they can help level up your web development process. To learn more about the amazing debugging features it offers, be sure to check out their documentation.
And if you're looking to take things even further, consider using a monitoring tool like Highlight. With its ability to detect errors and enable debugging in real-time, Highlight can help you make sure your app is running smoothly — giving you one less thing to worry about.
Other articles you may like
Feb 10, 2024 • 8 min. read
