Today, the Timeline Indicator gets a major revamp in Highlight, helping users navigate a session to find and fix issues faster than ever.
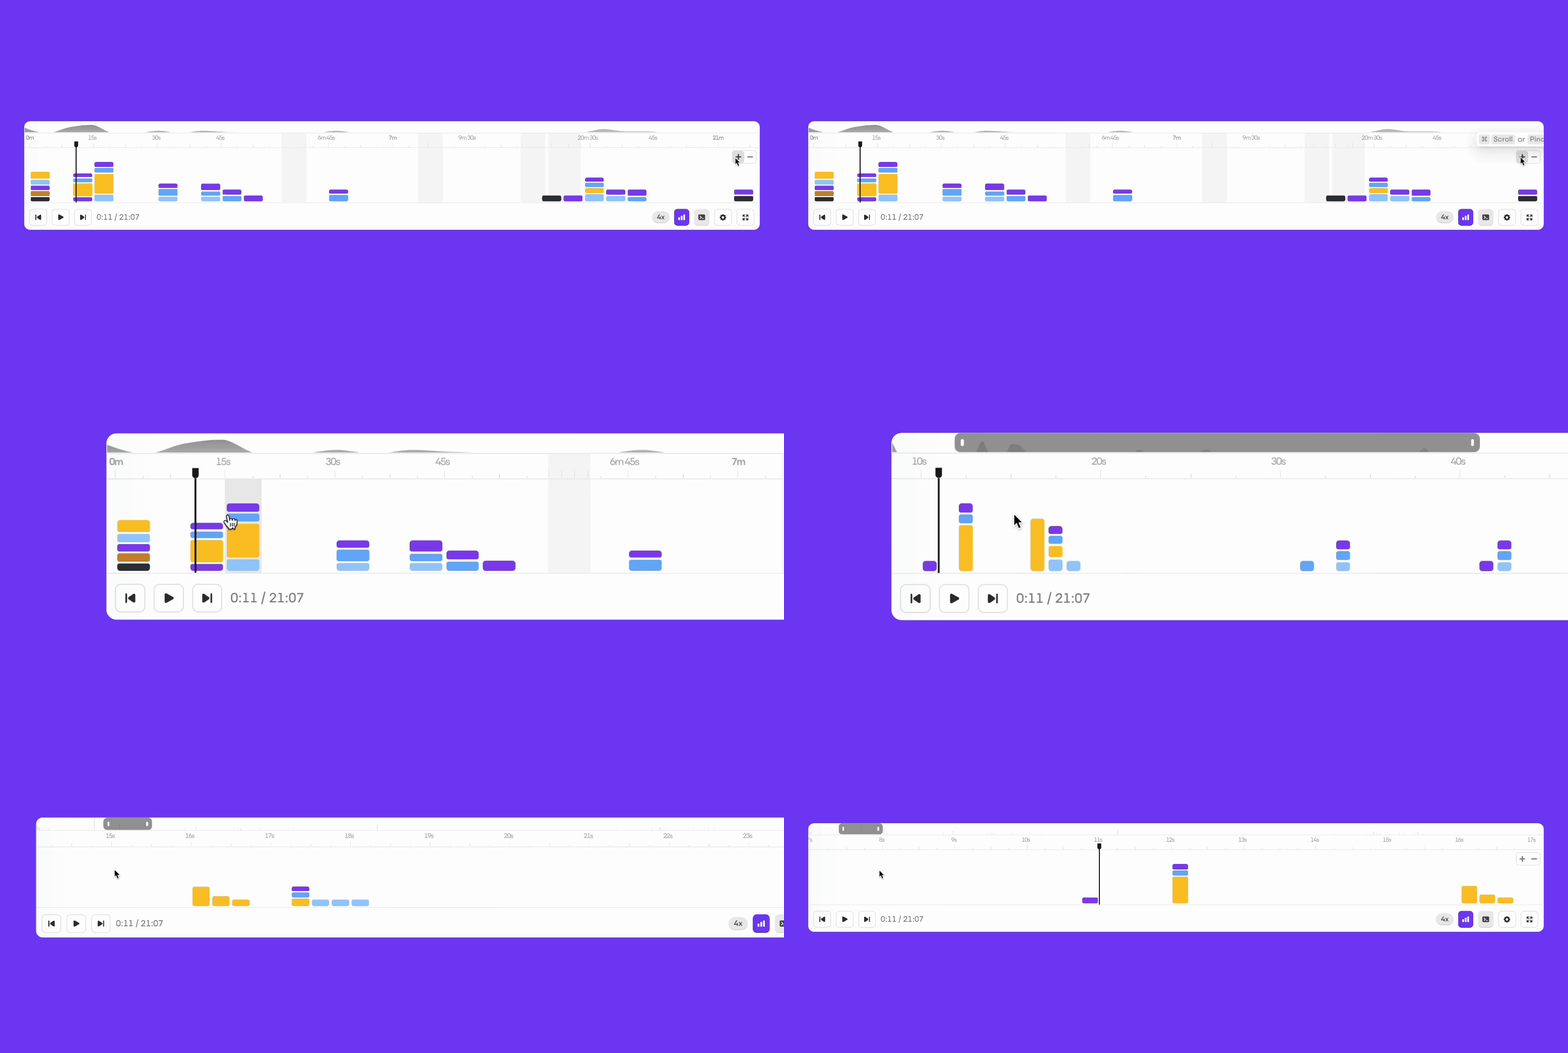
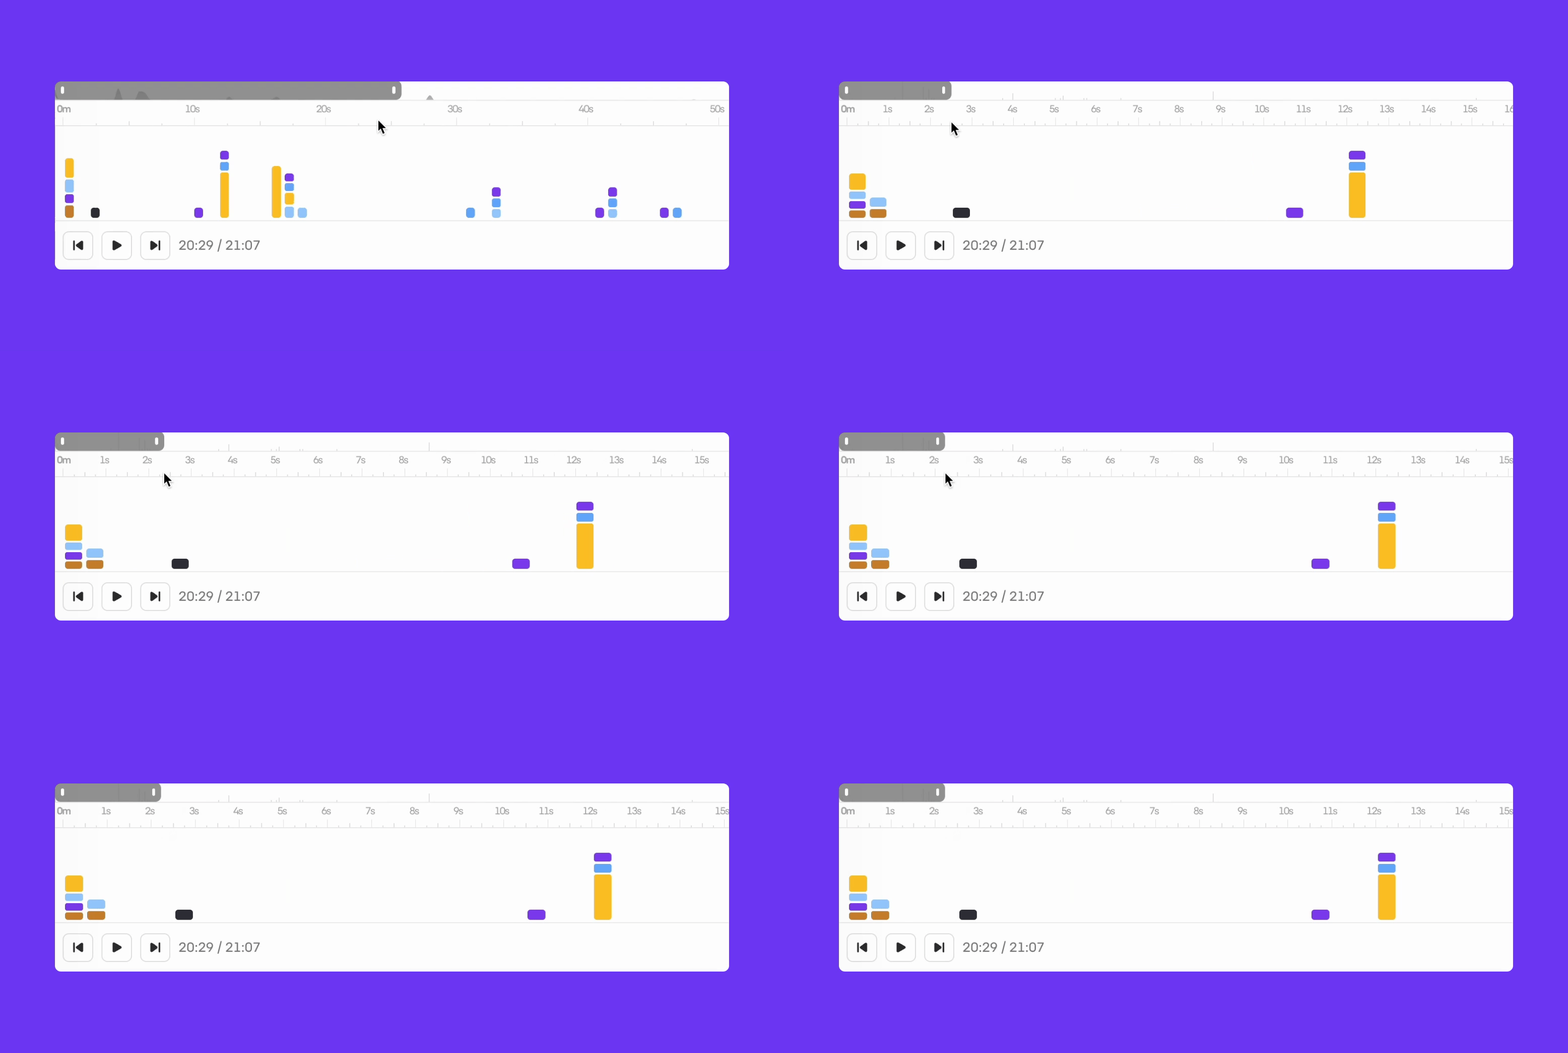
The new Timeline Indicator in Highlight is a visualization of all the events that occur over the course of a session, be it clicks, reloads, or any other actions you decide to track, and enables gestures for quick navigation: pinch to zoom and swipe to go back and forth.
Grouped Events
Previously, Highlight had events appear as colored dots on the timeline, no matter how many of them were in a session. For long sessions with a lot of user activity, this made debugging and analysis confusing and time-consuming.
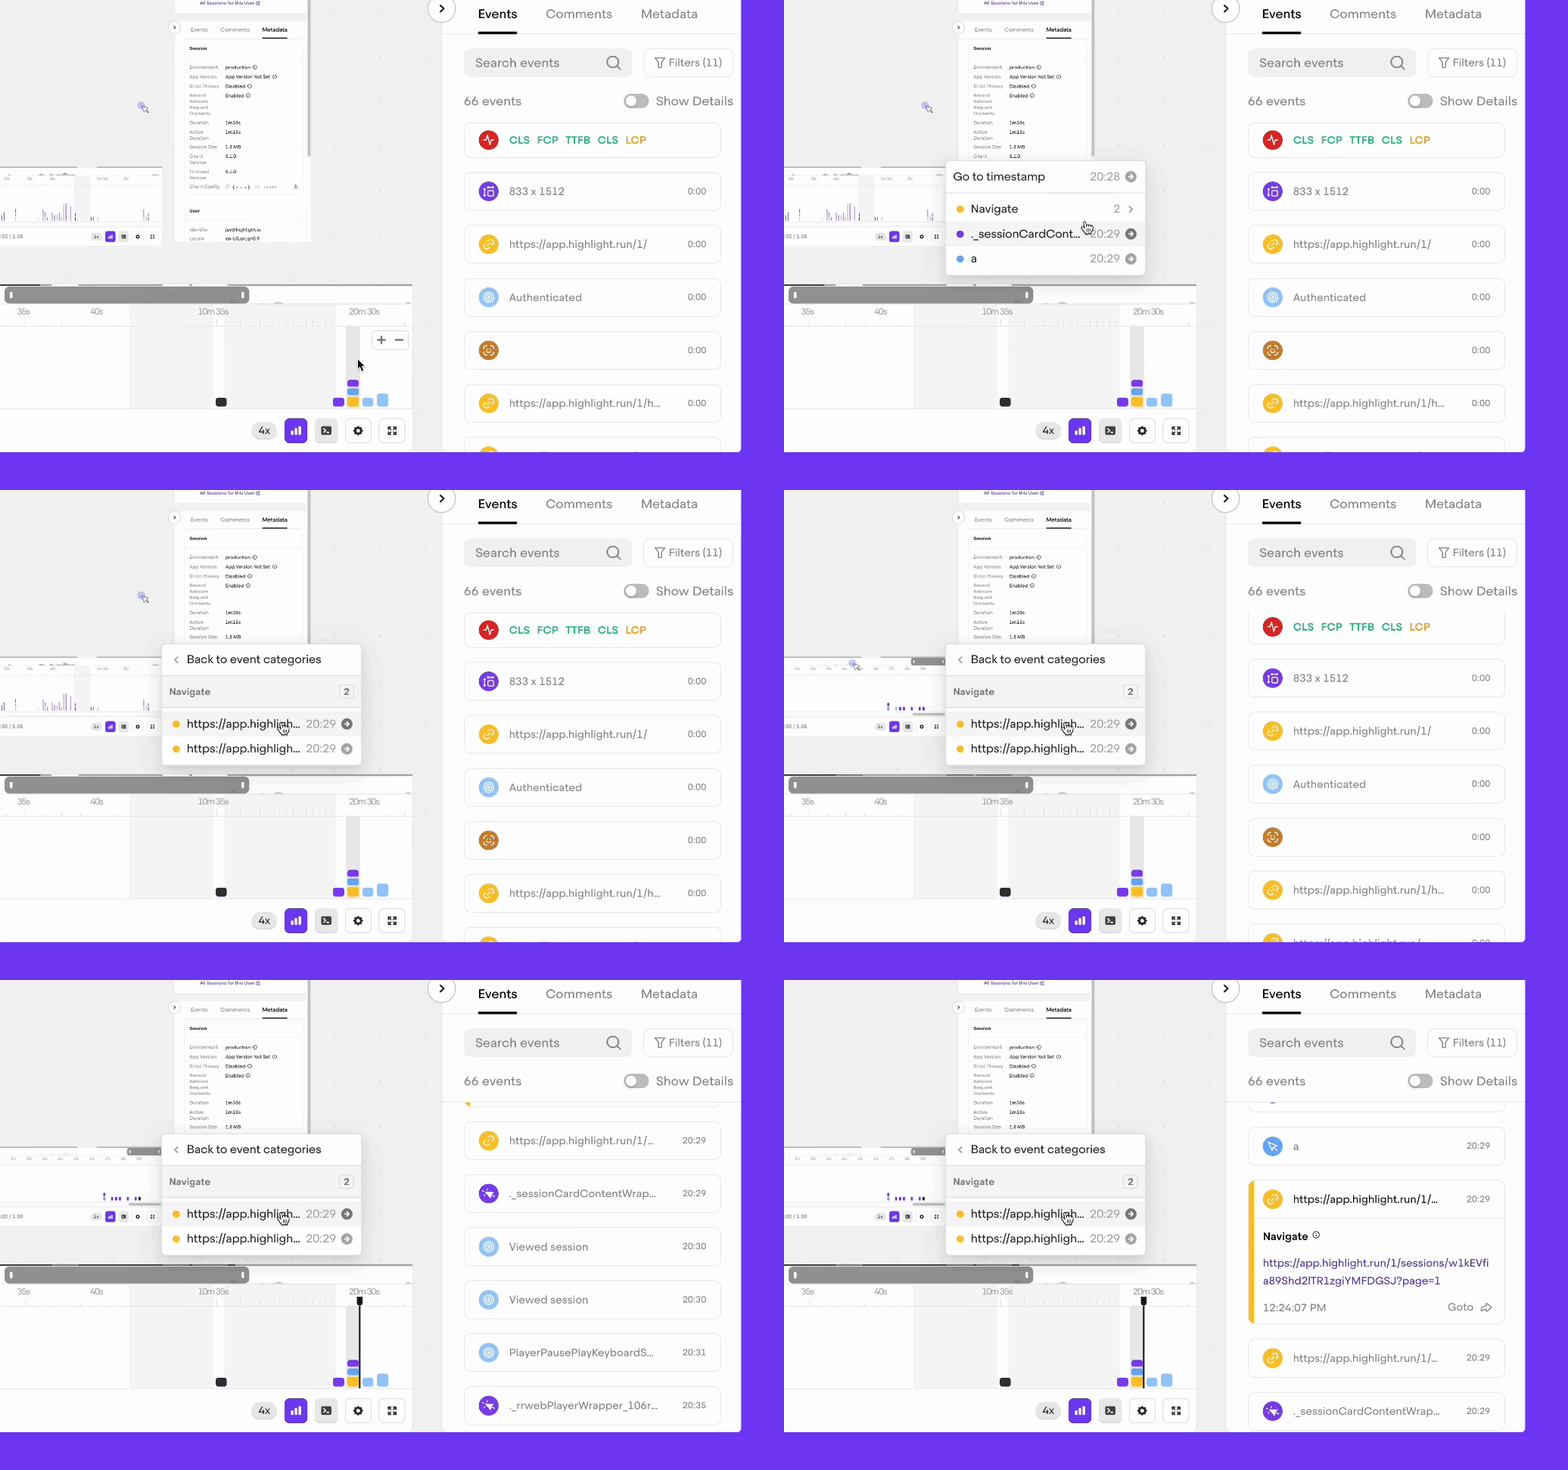
Now events are easier to digest. Rather than representing events as dots, we group events into buckets that you can interact with: click on them to see all the events in the time slot of interest.
And getting all the context you need for a particular event has never been easier. You can navigate to individual events to check out console logs, errors and network requests that happened at that particular moment.
The area chart on the top gives you an idea where you are in the session even after zooming into a session segment. Instead of gestures, you can also use the draggable session monitor to refine your focus.
New keyboard shortcuts
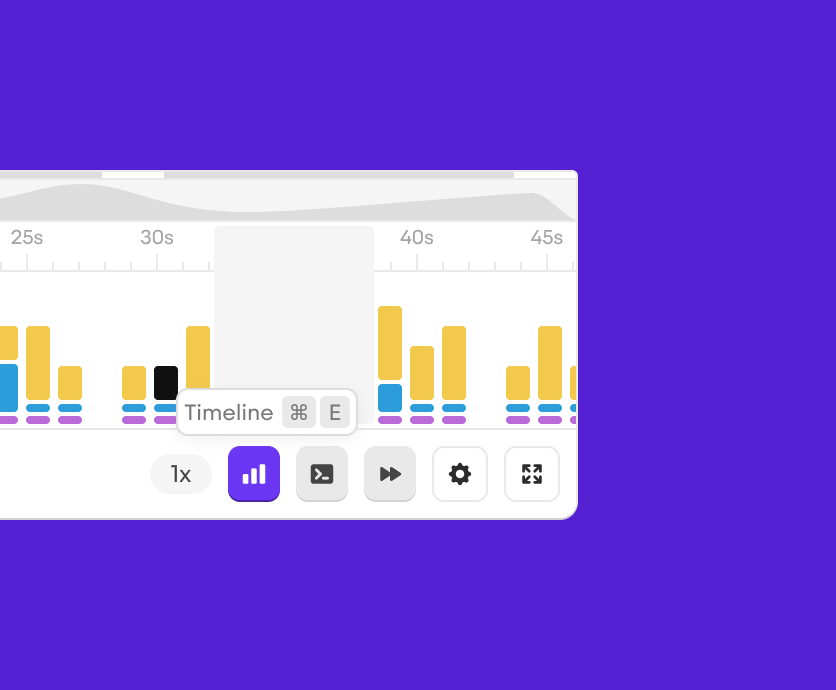
Power users can now use keyboard shortcuts to customize their workflow: hide the timeline, open the dev tools or change the replay speed all without touching the mouse.
You can see them by hovering over buttons, or pressing ? to open a list of all available shortcuts.
Player performance
With this launch, we’ve also put a lot of focus into the performance (and perceived performance) of our player. But using a combination of CSS animations & transitions, as well as making changes to our replay infrastructure, playing back a session in Highlight has never been smoother.
Try the new Timeline Indicator
The new Timeline Indicator is live for all users. Login to Highlight, open a session, and try it out today!


